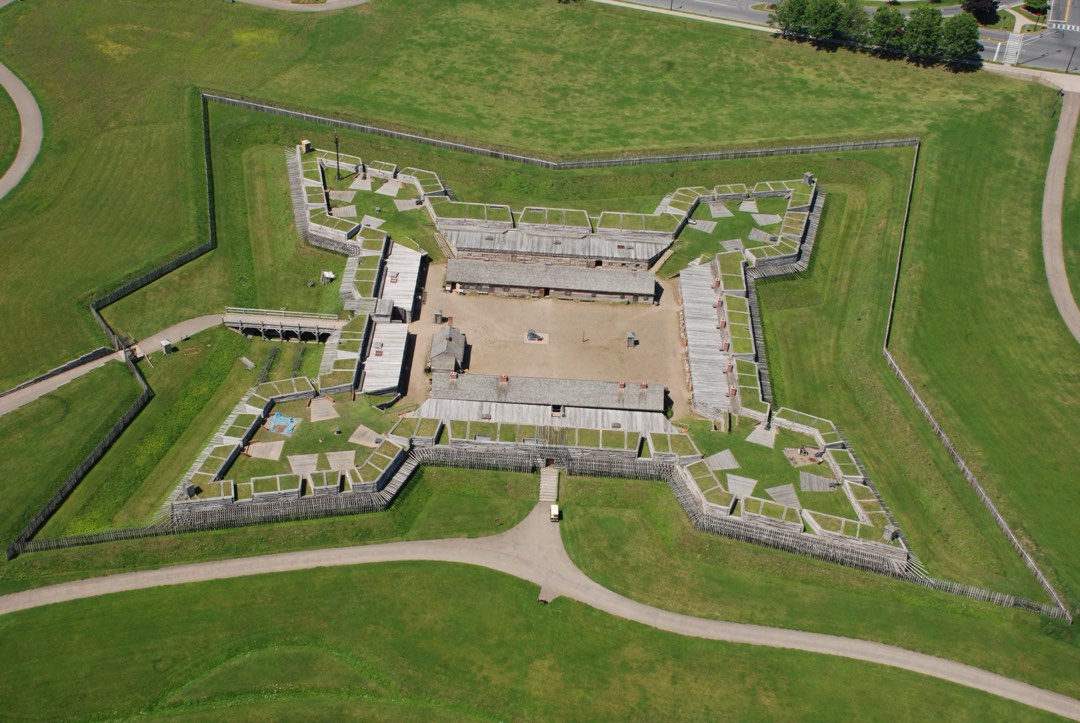
Best Time to Visit Fort Stanwix National Monument
JuneBest month to visit
Find places to stay →Our recommendation
Visit Fort Stanwix in June
June offers best overall balance of crowds, weather and daylight. For comparison, July is the most crowded month (~3.4× the average month) and January is the quietest.
Annual visits
78K
2025
Busiest month
Jul
3.4× avg
Quietest month
Jan
0.2× avg
10-yr trend
falling
-13.3%
More photos of Fort Stanwix

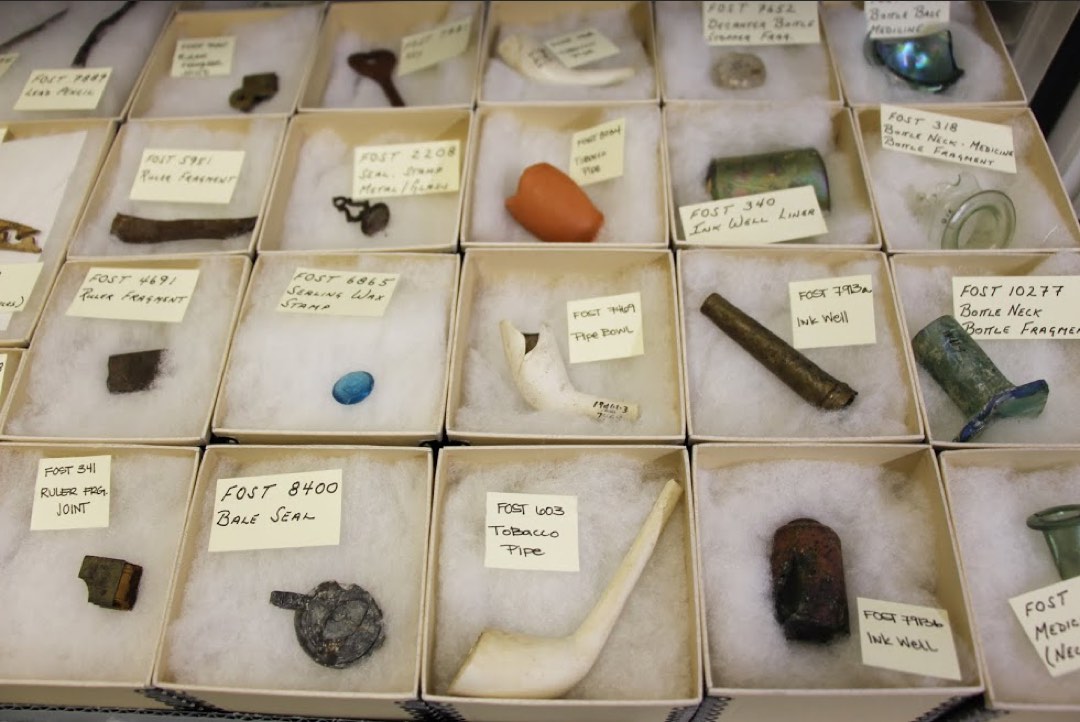
Photos courtesy of the National Park Service (public domain).
How crowded is Fort Stanwix by month?
Relative crowd level by month (1.0 = the park's average month), from NPS visitation records 1979–2025.
Month-by-month crowd, weather & daylight
| Month | Crowd level | Best-time score | Avg high / low | Daylight |
|---|---|---|---|---|
| January | Very quiet | 42 Poor | 30°F / 13°F | 9.1 h |
| February | Very quiet | 44 Poor | 32°F / 13°F | 10.3 h |
| March | Very quiet | 46 Fair | 41°F / 23°F | 11.6 h |
| April | Quiet | 57 Fair | 55°F / 34°F | 13.2 h |
| May | Average | 67 Good | 69°F / 45°F | 14.5 h |
| June★ best | Busy | 74 Good | 76°F / 55°F | 15.2 h |
| July | Very busy | 49 Fair | 81°F / 60°F | 14.9 h |
| August | Very busy | 72 Good | 79°F / 58°F | 13.8 h |
| September | Busy | 66 Good | 72°F / 51°F | 12.3 h |
| October | Quiet | 55 Fair | 59°F / 41°F | 10.8 h |
| November | Very quiet | 46 Fair | 47°F / 31°F | 9.5 h |
| December | Very quiet | 41 Poor | 36°F / 21°F | 8.8 h |
Climate normals (1991–2020) from the nearest NOAA station (USW00064775, ~3.2 mi away).
Email me when Fort Stanwix's crowd forecast updates
Get an email when new NPS visitation data changes the best time to visit Fort Stanwix or its month-by-month crowd levels. No spam, unsubscribe anytime.
About visiting Fort Stanwix
Fort Stanwix National Monument is a National Monument in NY and a relatively quiet park, drawing about 78,000 recreation visits in 2025. Visitation has eased over the past decade, down about 13.3%. Crowds concentrate sharply by season: July is the busiest month at about 3.4× the park's average month, while January is the calmest at roughly 0.2× — a 16-to-1 swing between high and low season. Roughly 54% of the year's visitors arrive in the three summer months of June, July and August alone, so timing a trip outside that window is the single biggest lever on how crowded the park feels. Weather swings from an average high-season warmth near 70°F in July down to about 22°F in January, with the wettest stretch in October. About 5 months a year see comfortable average temperatures in the 50–80°F range, which is part of why crowd timing and weather timing don't always line up. The sweet spot is June: best overall balance of crowds, weather and daylight. Visit then and you trade a little peak-season certainty for noticeably shorter lines and easier parking than the July rush. Daylight ranges from about 8.8 hours in midwinter to 15.2 hours near the summer solstice, which shapes how much ground you can cover in a day. These crowd figures are drawn from 1979–2025 of National Park Service visitor-use records, paired with 1991–2020 NOAA climate normals, and are updated as new monthly data is released.
Park overview
For centuries, the Oneida Carrying Place, a six-mile portage connecting the Mohawk River and Wood Creek, served as a vital link for those traveling by water from the ocean to the Great Lakes. When Europeans arrived, nations fought for control of the carry, the homelands of the Six Nations Confederacy, and the rich resources of North America. In this struggle, Fort Stanwix would play a vital role.
Weather & conditions
The Park lies within a temperate zone and experiences four full seasons. Summer can become very hot and humid. Snow is common as late as May and as early as October. The fort area can become muddy in all seasons. With most activities outdoors, good closed-toe walking shoes and low heels are advised. Air conditioning and heating is limited to park visitor center most times in the year. Water and extra layers of clothing in all seasons are always recommended!
Park overview text courtesy of the National Park Service — official park site.
Where to stay near Fort Stanwix
Hotels, cabins, lodges and vacation rentals near Fort Stanwix National Monument — live availability and prices to plan your trip. June is our pick for the best balance of light crowds and good weather. Full lodging guide: when to book, gateway vs in-park, and the crowd calendar that drives room rates.
Top-rated places to stay near Fort Stanwix
Prices for Sep 11–13, 4 adults. Change dates on the map below.
Availability and prices from Stay22 partners (Booking.com, Vrbo, Expedia). We may earn a commission from bookings, at no extra cost to you.
Planning a trip to Fort Stanwix?
Get the best time to visit Fort Stanwix plus lodging deals near the park by email. No spam, unsubscribe anytime.
Getting to Fort Stanwix
The nearest airport is Hancock International Airport (SYR), about 45 mi (59 min drive) away. Most visitors reach Fort Stanwix by car.
Frequently Asked Questions
June offers best overall balance of crowds, weather and daylight at Fort Stanwix National Monument. The park is busiest in July (about 3.4× the average month) and quietest in January.
July is the busiest month at Fort Stanwix National Monument, running roughly 3.4 times the park's average monthly visitation.
January is the quietest month at Fort Stanwix National Monument, at about 0.2× the average month — a good choice if you want to avoid crowds.
Fort Stanwix National Monument recorded about 77,507 recreation visits in 2025. Visitation has been falling over the past decade (-13.3%).
Based on 1991–2020 climate normals, the warmest month at Fort Stanwix National Monument averages about 70°F (July). See the month-by-month table above for the full picture.
Hancock International Airport (SYR) is the closest airport to Fort Stanwix National Monument, about 45 mi (59 min drive) away.
Nearby parks to visit
Keep exploring
Water quality of lakes near Fort Stanwix
If you are planning to swim, paddle or fish on this trip, these graded lakes are within a 40-mile drive. Grades are A–F from EPA and state-agency sampling.
- South Lake water qualityGrade A · 35 mi · NY
- Barnes Lake water qualityGrade B · 27 mi · NY
- Delta Reservoir water qualityGrade — · 6 mi · NY
- Oneida City Reservoir water qualityGrade — · 14 mi · NY
- Echo Lake water qualityGrade — · 17 mi · NY
Sources: National Park Service Visitor Use Statistics (1979–2025), NOAA NCEI U.S. Climate Normals 1991–2020. Crowd index = a month's visits ÷ the park's average month.